As we currently depend on vehicles to get around, nobody wants to be stuck in traffic, especially during rush hours where people are commuting to work, school, or any other important meeting.
Use eTags© to Quickly Complete Your DMV Service. Renewals, Title Transfers and More, All Online!
We expect to hit the road with the idea that nothing could go wrong while driving. However, a 2018 study made by WalletHub – a personal finance website based in Washington D.C. – has revealed a list of states that offer the greatest driving experience in the US.
For accuracy and completeness, this study analyzed information from all 50 states using 23 metrics including share of rush-hour traffic congestion, road quality, bridge quality, traffic fatality rate, average annual car insurance premium, and other factors such as car dealership per capita and gas station per capita.
All these data was grouped into four categories: cost of ownership and maintenance rank, traffic and infrastructure rank, safety rank, and access to vehicles and maintenance rank.
If you wonder how your state performs overall, this study takes every point into consideration and you may relate to any of the findings discussed below.
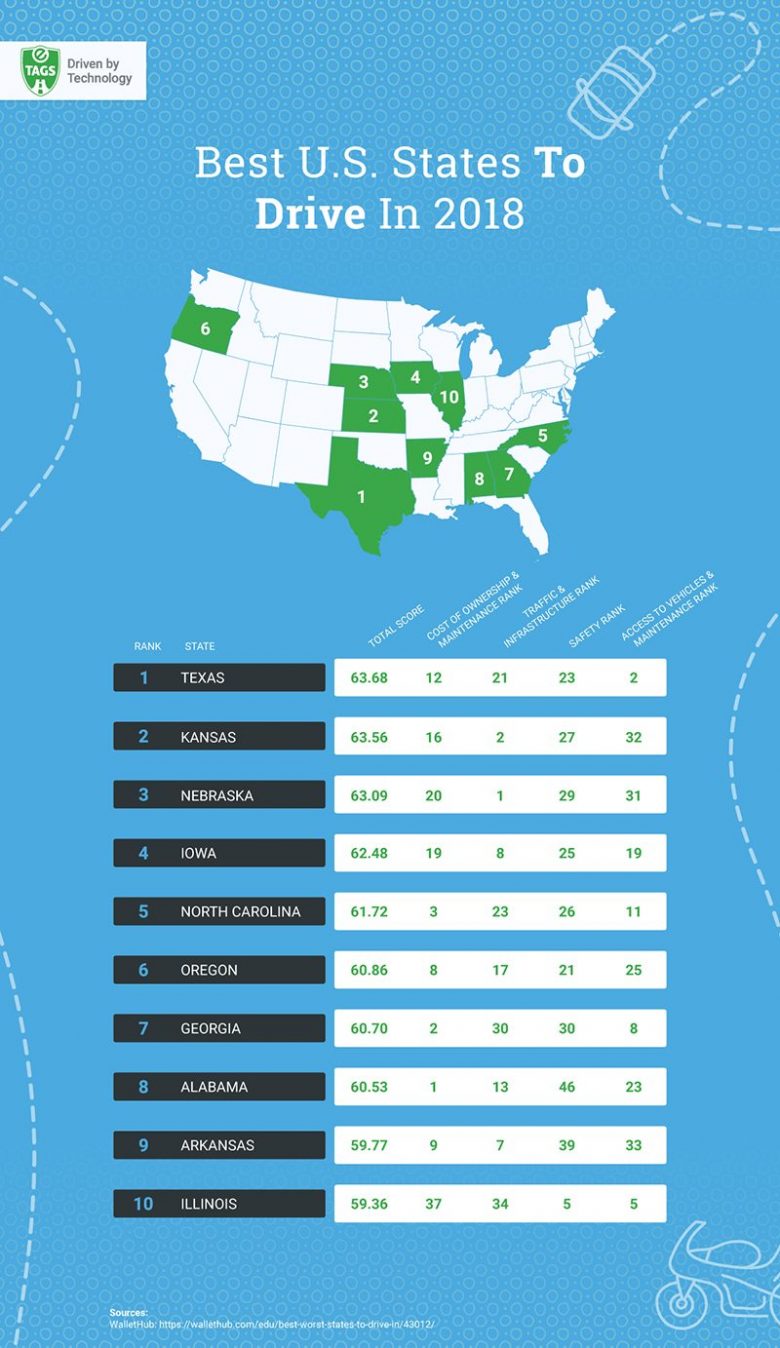
The 10 best US states to drive in 2018
The table covers a lot of factors and the metrics in use are substantial when it comes to drilling down through the data.
For that reason, eTags has created an infographic that conveniently helps users to identify the 10 best US states to drive in 2018.
If you are from Texas, you’ll be glad to know that your state ranks as the best state to drive in the US.
In fact, Texas has one of the lowest average gas prices in the country, along with lower precipitation rates which decreases the chances of getting stuck in traffic due to heavy rains.
Moving on, Kansas ranks second on the list with an overall score of 63.56. It’s worth pointing out that Kansas ranks second in Traffic and infrastructure, while getting a strong position by ranking 16th in Cost of Ownership & Maintenance.
Kansas also shows optimal performance when it comes to Safety and Access to Vehicles and Maintenance, ranking 27th and 32nd respectively.
Now, let’s review Nebraska. Ranking at third place on the list, Nebraska scores 63.09 which has more to do with its highest traffic and infrastructure developments.
When it comes to other categories, say Safety, Cost of Ownership and Maintenance, or Access to Vehicles and Maintenance, Nebraska displays average performance rates of 29th, 20th, and 31st respectively.
Have a look at the infographic. You may be from one of the states that made it into the top 10 list. If so, how would you rate your driving experience? Do you agree with the scores given by this recent study?
Feel free to let us know in the comments below.
SEE ALSO: 5 Simple Steps To Reduce Traffic Congestion
Share This Infographic – Copy & Paste Embed Code Below:

