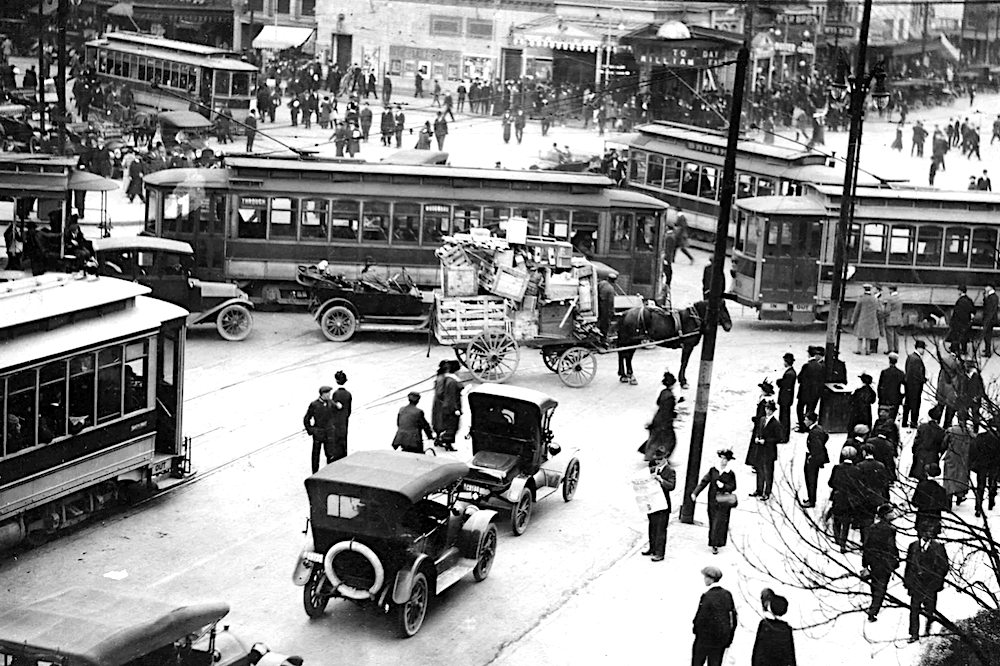
In the early 1900s, horse-drawn carriages and buggies were how people got around. No stop signs, traffic lights, lane lines, driver’s licenses, speed limits or any of the things we’ve come to associate with driving in the modern world. Driving was a chaotic adventure earlier on, with motorists driving however they chose, parked wherever they want, and accidents were a common affair.
Use eTags© to Quickly Complete Your DMV Service. Renewals, Title Transfers and More, All Online!
Horse-drawn carriages and buggies used to cost as little as $25 to $50 and could be driven by almost anyone – even children
In fact, a Detroit News article reported that by 1916, one-fourth of the Detroit police force or 250 officers were managing traffic. One year later, Detroit and its suburbs had 65,000 cars on the road resulting in over 7,000 accidents and 168 fatalities. In 1913, New Jersey required drivers to prove that they can in fact drive. Early driving tests were not successful, 30% failed the test in the first week alone. In the following year, only 2%-3% of New Jersey’s population had a driver’s license
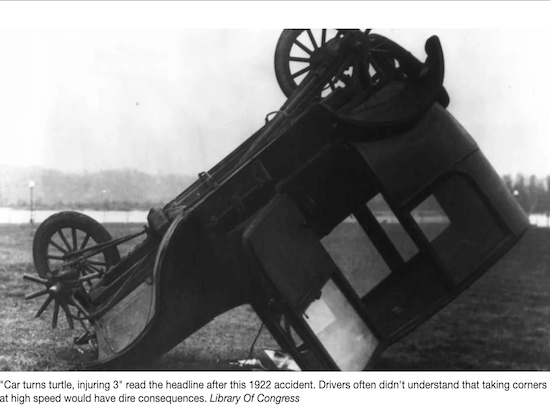
According to the Automobile Club of America, by 1909 there were about 200,000 motorized cars in the U.S., and by 1916, 2.25 million. Today, there’s about 267 registered vehicles in America and over 228 driver’s licenses. With more and more people getting behind the wheel, the Department of Motor Vehicles was created in 1915.
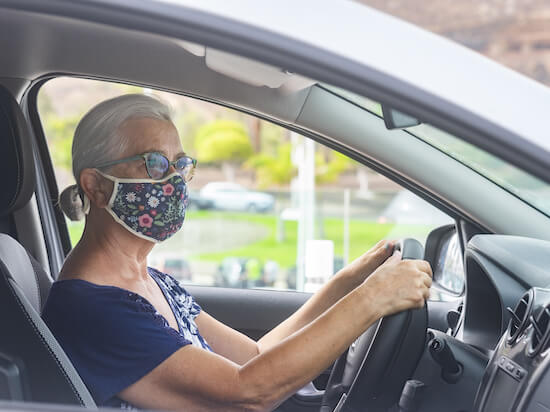
These days, Americans drive about 14,300 miles a year according to the Federal Highway Administration. That’s almost three roundtrips between Los Angeles and New York. Collectively, we drive over 3 trillion miles annually.
The first stop sign was used in Michigan in 1915. It was black with white lettering and slightly smaller than today’s design. By 1922, stop signs were standardized
The FHA says California boasts the most total miles driver every year, with 340 billion miles traveled. Wyoming, however, has the highest mileage per person on average at 24,000 miles driven. Motorists in Washington D.C., Rhode Island, New York, Washington, and Alaska drive the least miles annually. Men drive about 6,000 miles than women, while retirees drive about 30% less miles.
Women over 65 drive the least, while men ages 35-54 drive the most
Oklahoma drivers only have 44 billion miles driven collectively, but each person drives over the national average, with 17,700 miles traveled. Florida, where eTags registration and title services company’s headquarters are, boasts 226 billion miles driven every year. When calculating how much each Floridian drives, the result is 14,557. Another state eTags operates in, Maryland, boasts only 60 billion miles driven as a collective.

American drivers typically drive too close to the vehicle in front of them aka tailgate. Drivers on both the east and west coast tend to follow the rules for the road more than those in the Midwest, west, and south. Drivers in urban states tend to drive less, while those in rural areas drive much more.
Americans now spend twice as much on gas annually than in the 1950
What’s interesting in the findings is that how much roadway a state has doesn’t correlate with driving habits. For Wyoming for example, it’s the opposite. They have some of the least lanes, but drivers there rank first in miles driven…24,000 a year!

Every year, there’s a list of the top states with the worst drivers. But generally speaking, the denser the traffic, the worse the driving behaviors. Los Angeles, New York, Miami, Houston, Washington DC, and San Francisco generally hold the top spots for worst drivers.
Vermont boasts the least miles driven as a collective, but each driver puts on over 13,000 miles on their vehicle annually
As far as how COVID-19 changed some of our nationwide drive habits; vehicle travel dropped 60% when lockdowns started in April. Average miles driven returned its baseline over the summer of last year, but still about 10% lower than normal. Even with less miles traveled, accidents increased, and fatalities rose the number of people killed on the 4.6% in the first nine months of 2020.
SEE ALSO: LAST YEAR HAD 8% MORE TRAFFIC FATALITIES THAN 2019 DESPITE PANDEMIC
