The Florida Department of Highway Safety and Motor Vehicles has disclosed its latest report about traffic crash statistics in the state of Florida.
Use eTags© to Quickly Complete Your DMV Service. Renewals, Title Transfers and More, All Online!
If you live in Florida or planning on moving, have a look at these Florida traffic crash statistics. These 2017 statistics compare the traffic crashes that took place in South Florida against the entire state.
Note that FLHSMV creates this annual report based on data collection and research. Take this information as a valuable tool that puts on display important facts about public and vehicle safety.
Once again, eTags has adapted this infographic for easier interpretation and comparison of data, and there is no better way of learning more about road facts than using statistics.
Total Crashes
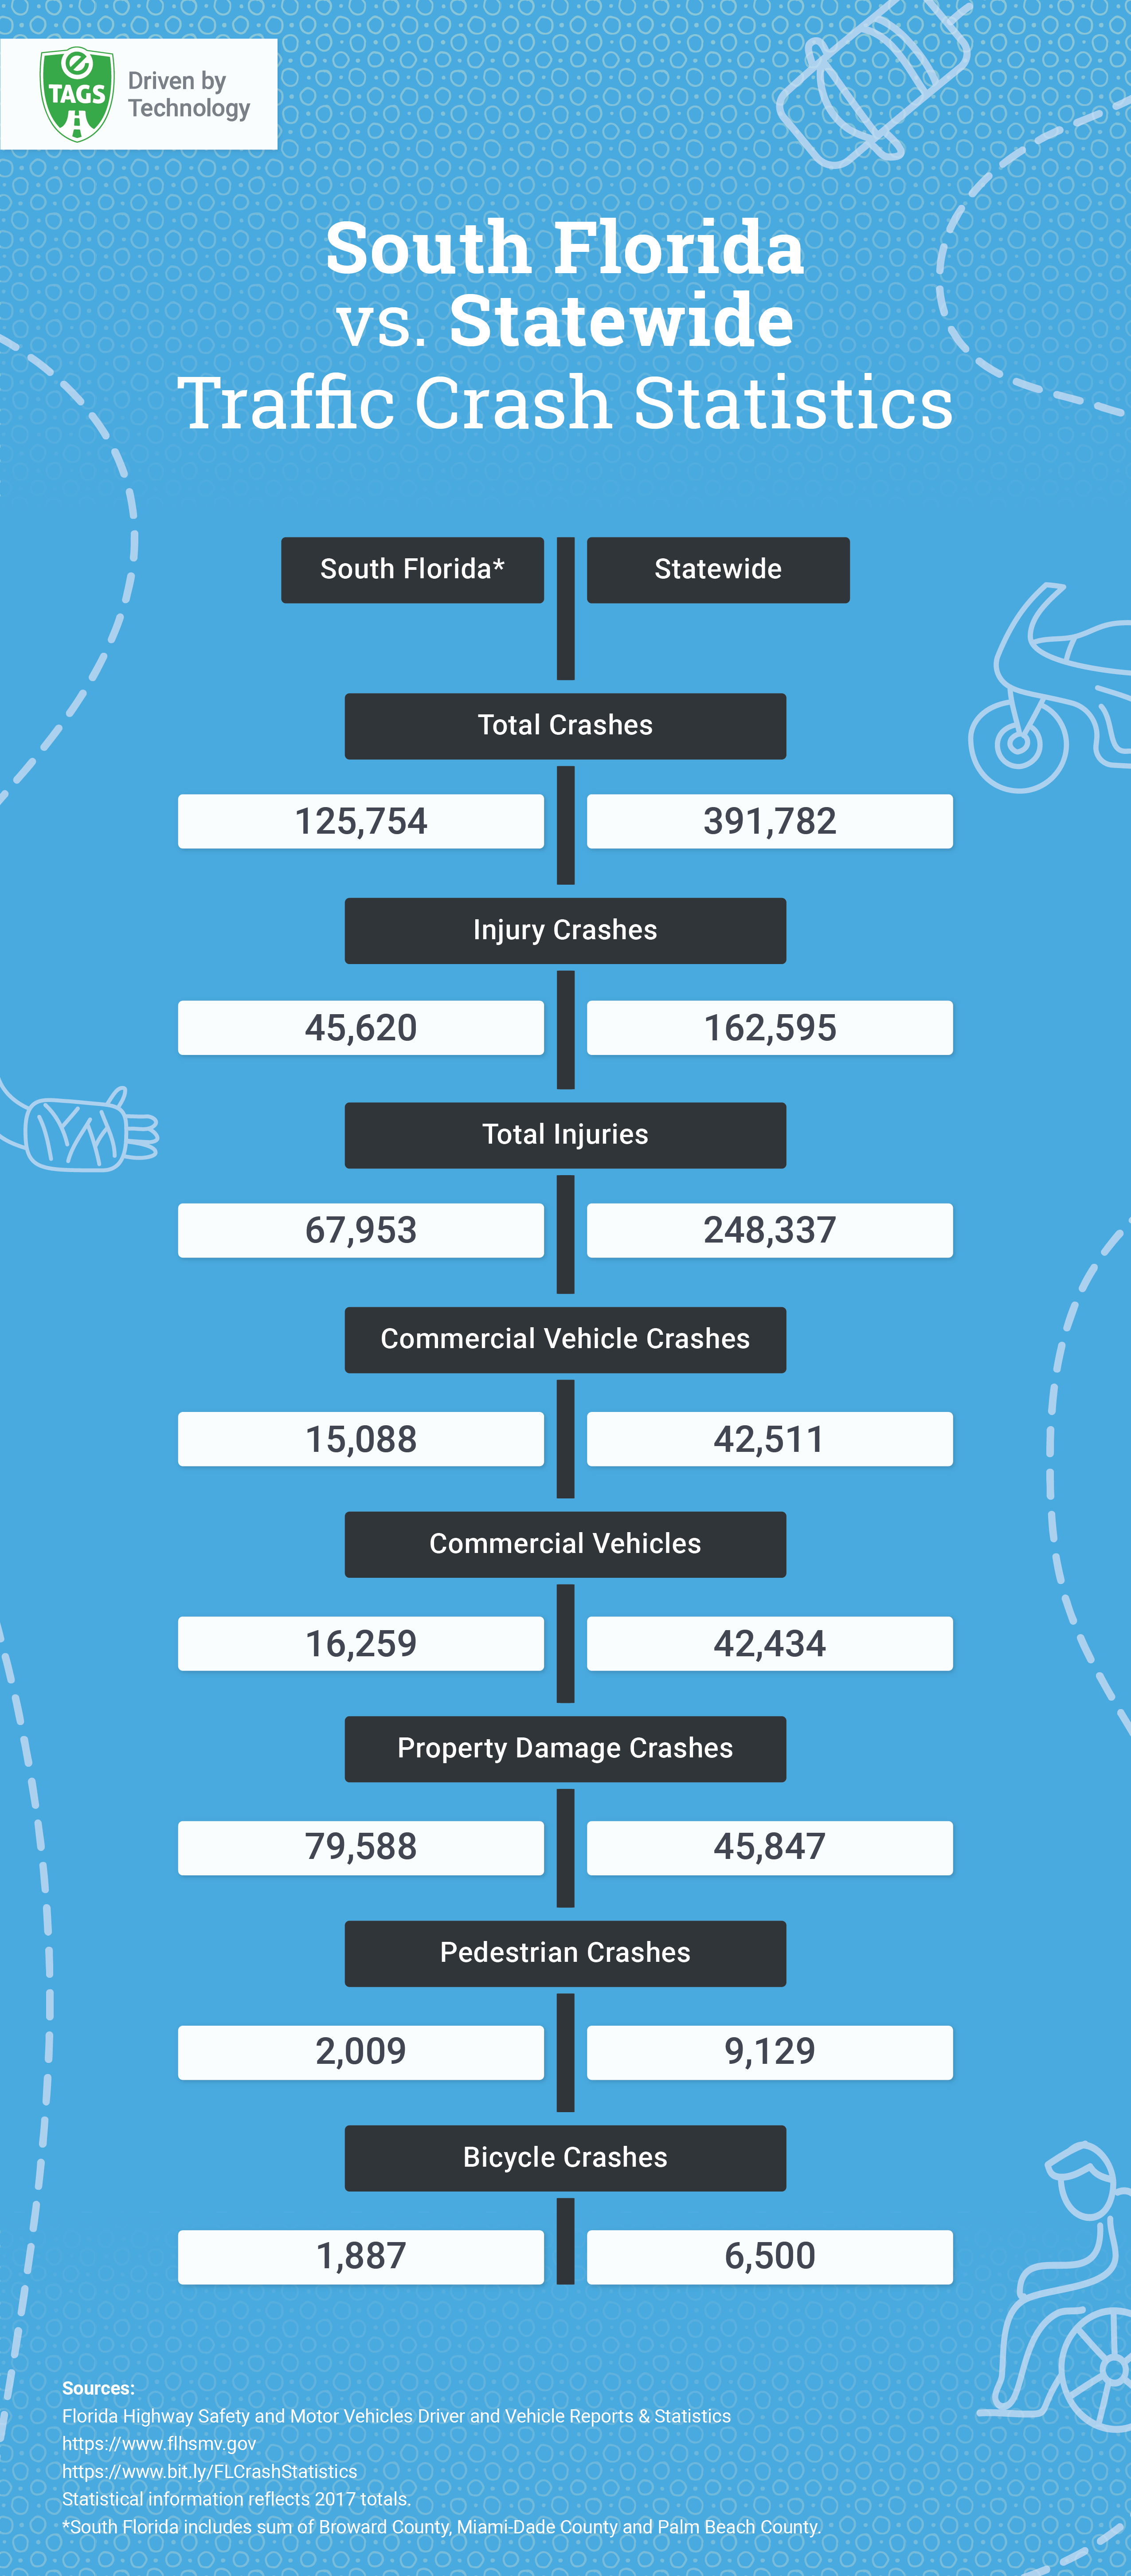
As you can see in the infographic below, there is a total of 391,782 crashes in the state of Florida, in which 125,754 crashes took place in the South Florida region.
That said, the total traffic crashes rate in South Florida represents 30-35% of the entire state. That’s alarming and considering the amount of car accidents that take place in key areas, say Miami Dade, there is still a lot of work to do.
Injury Crashes
Have a look at “Injury Crashes. In this section, injury covers hurt, damage, or loss sustained by an individual as a result of a traffic crash.
In 2017, injury crashes accounted for 45,620 in South Florida. This is roughly 28% of the total amount of injuries in the entire state.
For that reason, it is always a good idea to keep enhancing accident prevention programs across the state. Getting involved in a car accident could be terrible for your vehicle and insurance, but putting your life at risk is fatal.
Pedestrian Crashes
Looking down on the graphic you’ll find pedestrian crashes. This happens when a person gets hit by a driver who was driving without paying attention to the road.
It could also be that pedestrians failed to look at the walking signals, increasing the chances of getting involved in a pedestrian accident.
It is estimated that approx. 22% of the total pedestrian accidents in Florida took place in the Southern region. That’s unfortunate but further education and safety campaigns could reinforce road attention for everyone.
Think about it
What is your opinion about these statistics? Do you think there’s a lot to be done when it comes to preventing car accidents?
The more people get educated with these facts, the better for drivers, pedestrians, and cyclists.
Driving responsibly is not only a matter of following the law and road signs, but also a matter of getting enough coverage and the right skills before hitting the road.
Have a look at this infographic. Whether you drive a commercial vehicle, or got involved in a property damage crash, learn from it.
If you want to leave any comments or questions, feel free to add it below. Of course, you can share this info with your friends and family, to keep enhancing traffic crashes awareness.
SEE ALSO: Here Are The Top California Cities For Vehicle Theft [Infographic]
Share This Infographic – Copy & Paste Embed Code Below:


2 comments
Wow, definitely scary statistics! Does anyone have an idea of why Florida is overrepresented? Less strictly enforced drinking laws? More bars? More dangerous/poorly maintained roads? Less police officers?
Hello Anne. That would be a matter of researching what causes Florida to rank high on crash statistics. It’s definitely something that involves more than one single factor apart from law enforcement.